
Are you looking for the best children’s ministry statistics? You’re in the right place! Ministry Architects has been in the game for a long time and we’ve found a lot of themes in that time. From children’s ministry budget to normal attendance, we want to share everything we’ve learned with you.
In children’s ministry, we work with four different norms:
- Attendance
- Staffing
- Budget
- Volunteers
As you look at these numbers and compare them to your church’s numbers, remember that this data represents an average of hundreds of churches from all across the country. There are many factors that influence why your church looks the way it does and why your numbers may vary. Some of the most common variables are cost of living, complexity of programming, number of programs, number of monthly and yearly events, and church culture.
ATTENDANCE: How We Count
We define ‘child’ to include all young people who are newborns through elementary ages. To help you understand how we count the number of children engaged, consider this example of Made Up Church. The weekly children’s attendance of Made Up Church includes the following numbers:
– 20 children each Sunday in Sunday school
– 35 children each Wednesday in children’s choir practice
– 15 children each Sunday sit in worship with their families but don’t participate in any other program
At Ministry Architects, we like to count unique faces. That means, if a child goes to Sunday school and children’s choir every week – they only count once. Not twice. And if a child only attends worship, but hasn’t yet attended Sunday school or children’s choir, they, too, count. So, any child who participates in the life of the church in some way is included in this number. But we only count them once, no matter how many times they are at the church in a given week.
ATTENDANCE: What “should” our children’s attendance be?
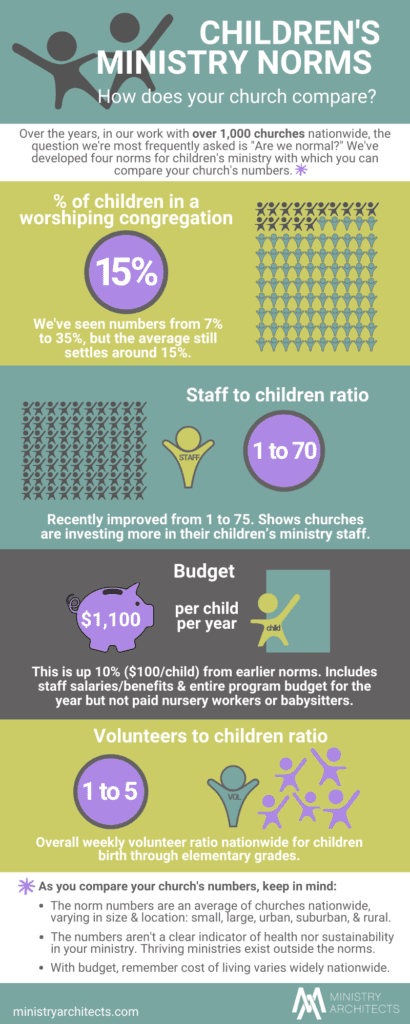
When considering “what’s normal,” the average number we have seen is 15% of the worshipping congregation. Therefore, for every 100 weekly worshippers, the average church has around 15 children participating in the life of the church in some way. In determining these children’s ministry statistics, we have seen percentages as low as 7% and as high as 35%. But in reviewing current numbers with recent clients’ churches, the average still settles around 15%.
VOLUNTEERS: How many volunteers are involved in the average church’s children’s ministry?
We know that every responsible children’s ministry has ratio targets that are different for each age group. However, we found that the best way for us to name a national norm is to look at the overall volunteer ratio for children from birth through elementary grades. Because churches use different rotation models, we standardized this for our children’s ministry statistics by looking at the average number of volunteers serving during any given week. That means that whether volunteers are serving once a month or once a week didn’t impact this number. We were simply looking at volunteer attendance numbers and children’s attendance numbers. On average, churches are seeing one volunteer for every five children attending each week.
STAFFING: How many paid staff are devoted to children’s ministry?
The current trend we’re seeing is that churches are investing more in their children’s ministry staff than they have, historically. The average ratio of staff to children across the country is the equivalent of one full-time staff member for every 70 children.
BUDGET: What’s the average financial investment for a children’s ministry?
Budget numbers have increased by about 10% as well. Currently, churches are reporting, on average, that they are investing $1,100 per child per year. This number doesn’t include paid nursery workers or babysitters, but it does include staff salaries and benefits as well as the entire program budget for the year. So if you have 50 children participating in the life of the church in some way, this norm would inform the children’s ministry budget be at least $55,000 to support maintaining that level of engagement.
What’s next?
If you’ve seen something you would like to talk more about or if you have questions about moving your church from where you are to where you want to be, we’d love to know! Just send an email to info@ministryarchitects.com and one of our consultants will contact you.
Free Ministry Coaching Call
We’re excited to have the chance to talk about your ministry! Please fill out the form below, and we’ll get back to you soon with next steps!