
It can be difficult to find good youth ministry statistics. In a world where so much ministry is trial-and-error, it’s hard to imagine such a thing might even exist. But it does! Here you will find time-tested norms on everything you need to know for a healthy ministry.
In youth ministry, we work with four different norms:
- Attendance
- Staffing
- Budget
- Volunteers
As you look at these numbers and compare them to your church’s numbers, remember that this data represents an average of hundreds of churches from all across the country. There are many factors that influence why your church looks the way it does and why your numbers may vary. Some of the most common variables are cost of living, complexity of programming, number of programs, number of monthly and yearly events, and church culture.
ATTENDANCE: How We Count
We define ‘youth’ to include all young people who are in middle school through high school. To help you understand how we count the number of engaged youth, consider this example of Made Up Church. The weekly youth attendance of Made Up Church includes the following numbers:
– 20 youth each Sunday in Youth Group
– 35 youth each Wednesday in small groups
– 15 youth each Sunday sit in worship but don’t participate in any other program
At Ministry Architects, we like to count unique faces. That means, if a youth goes to youth group and is in a small group every week – they only count once. Not twice. And if a youth only attends worship, but hasn’t yet attended youth group or small group, they, too, count. So, any youth who participates in the life of the church in some way is included in this number. But we only count them once, no matter how many times they are at the church in a given week.
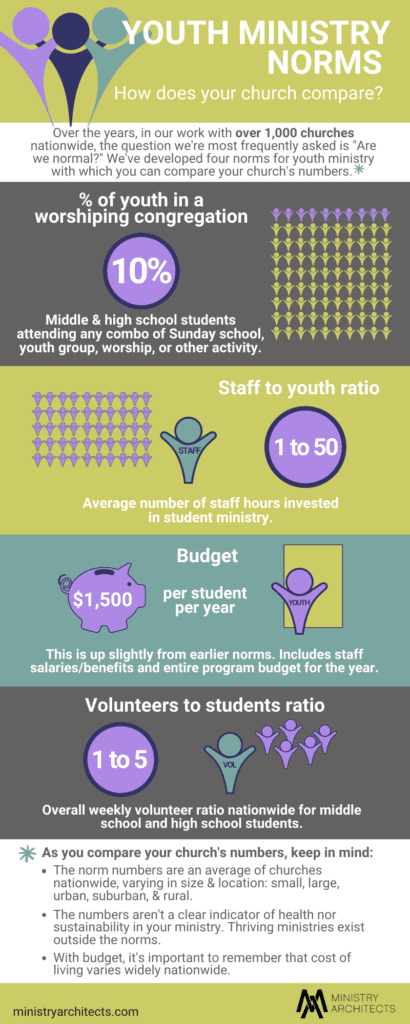
ATTENDANCE: What “should” our youth attendance be?
When considering “what’s normal,” in terms of how many youth are involved in the life of your church, the average number we have seen is 10% of the worshipping congregation. This means that the best youth ministry statistics say that for every 100 weekly worshippers, you should have around 10 youth participating in the life of the church in some way.
VOLUNTEERS: How many volunteers are involved in the average church’s youth ministry?
This norm has stood the test of time. Over the years, we have consistently seen an average of one adult volunteer for every five youth involved in the church in some way.
STAFFING: How many paid staff are devoted to youth ministry?
Churches typically hire the equivalent of one full-time staff person for every 50 youth involved in the church in some way. Staffing configurations can take on different forms. But we count the average number of staff hours the church is investing in youth ministry.
BUDGET: What’s the average financial investment for a youth ministry?
Budget numbers have increased over the years with churches reporting, on average, that they are investing $1,500 per youth per year. This number includes staff salaries and benefits as well as the entire program budget for the year. So, if you have 50 youth participating in the life of the church in some way, this norm would inform the youth ministry budget be at least $75,000 to support maintaining that level of engagement.
What’s next?
If you’ve seen something you would like to talk more about or if you have questions about moving your church from where you are to where you want to be, we’d love to know! Just send an email to info@ministryarchitects.com and one of our consultants will contact you.