
Are we still normal?
At Ministry Architects, we’ve worked with over 1,000 churches, and, inevitably, this is THE most frequently asked question. Based on all that we’ve seen and come to understand about what helps support a sustainable ministry, we’ve developed some norms. These benchmarks and ministry statistics are just a way to compare some numbers from your church with the same numbers in other churches.
Before You Compare: A Few Important Notes
Before taking a closer look, here are a few important notes you will want to keep in mind as you consider where your church lands amongst this data:
These Are Averages, Not One-Size-Fits-All Answers
These numbers are an average from the churches we have worked with all across the country. Our work with congregations of all shapes and sizes and in a variety of contexts has helped inform our norms. Whether your church is small or large, set in an urban, suburban, or rural setting, homogeneous or diverse, somewhere in this data is a church that looks like you. And, we revisit them annually and update them as significant changes are taking place, such as the impact of the COVID-19 pandemic on the church.
Norms Are a Starting Point, Not a Measure of Health
These numbers are not a clear indicator of health or sustainability in your ministry, but are hoped to serve as a baseline for comparison and a starting place when considering investing fresh attention in a ministry. If your church falls outside of these norms and you still have a thriving ministry, that’s to be celebrated! Many churches fall on both sides of the norms and have a vibrant, healthy ministry. And it suggests that variables outside these norms are contributing to that health.
Using the Data Wisely in your Local Context
These numbers enable you to have more conversations about your unique needs and circumstances, and make adjustments accordingly. As you look at these numbers, especially the budget numbers, remember that the cost of living varies widely across the country. For example, if you are in New York City, you may need to invest in your staff at a higher rate than a church in Bryan, TX. It doesn’t change the average, but it does explain why your staff budget is higher than another’s. But by looking at these norms and comparing them to your own church’s numbers, you can learn how you compare to the national average and use that information when discussing the distribution of resources in your specific community.
Relevant to Churches Right Now
While most of these numbers have held up through the pandemic, we have seen a few revisions to the church-wide norms, and the youth ministry participation norm may decrease over the next year or two. Ministry Architects exists to support healthy systems and innovative change for the future of the church. And in a world that’s ever changing, we know how important it is for content and resources to be relevant and useful right here, right now. Including the useful information you’re about to discover.
The Seven Ministry Norms We Track
If you are looking for the best church statistics and church budget data, you’ve come to the right place. As we’ve expanded our work over the years to guide and support whole church initiatives, we’ve identified seven different norms that are useful when it comes to comparing your church numbers with numbers from other churches:
- budget
- staffing
- payroll
- volunteers
- visitors
- groups
- facilities
As you look at these church statistics in a comparative light, remember that this data represents the average of hundreds of churches across the country. There are many factors that influence why your church looks the way it does and why your numbers may vary. Some of the most common variables are the cost of living, the complexity of programming, the number of programs, the number of monthly and yearly events, and church culture.
Attendance: How We Count
In terms of attendance, we measure weekend worship attendance as an average. Though your church may have more (or fewer) members on the rolls, the number we use is the average worship attendance over the course of a year. We don’t measure by the number of names in your directory. You may wonder, “Does this include online attendance?” It’s an important number to keep track of and pay attention to. In many churches, it has only increased since the pandemic. Yet, it’s tricky to count and track, so the norm does not include online attendance.
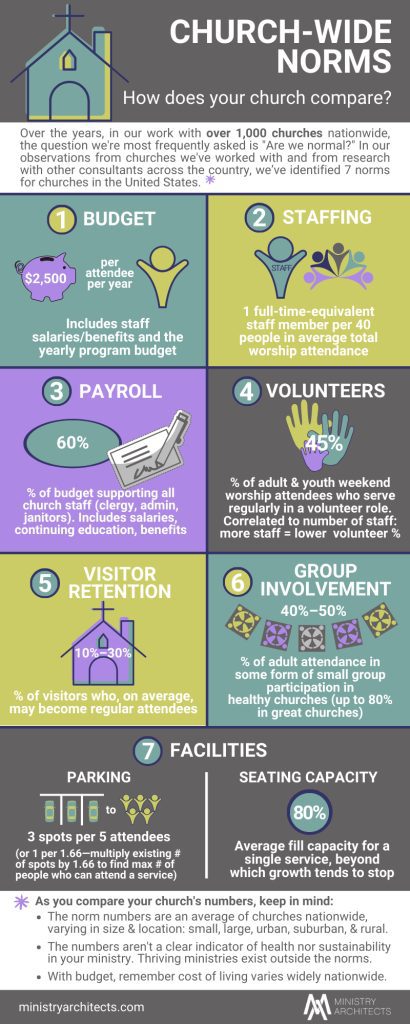
Budget
When it comes to financial resources, we are seeing churches invest an average of $2,500 per attendee per year. This includes staff salaries and benefits, as well as the yearly program budget. So, as an example, if a church averages 100 attendees in worship every week, this norm would inform the church ministry budget to be at least $250,000 to support maintaining that level of engagement. The reason for this increase is largely due to lower average attendance in a large number of churches, and it has been significant enough to shift the number.
Staffing
In terms of people resources, we’ve found that most churches have the equivalent of 1 full-time staff member (40 hours per week) for every 40 people in average total worship attendance. You may remember this used to be 1 to 75. The story is similar. The change is largely due to a lower average weekly attendance number in worship, while many churches have fought to protect the staff that are in place. Here’s the good news! You know the thing you only dreamed of doing when you had enough staff to do it? Now might be that time!
It’s also important to keep in mind that churches in an active growth season are typically staffed in the range of 1 full-time equivalent (FTE) for every 86-100 worship attendees. This is usually because churches that are growing are engaging more lay people in the leadership of the church, rather than paying staff members to do most of the work, and this continues to remain true at the end of 2025.
Payroll Percentage
As you might anticipate based on the changes above, the payroll percentage has also changed. Prior to 2020, the payroll percentage held steady between 45-55%. However, having the same number of staff for a smaller congregation also tends to affect the church budget and how staff and ministries are budgeted. As you consider your entire budget, inclusive of all the financial needs of your church, what we’ve learned in 2025 is that 60% of the church budget tends to support the staff of the church. This percentage includes salaries, benefits, and continuing education. These church statistics also include all staff positions, regardless of title, role, or job type (full-time, part-time, contract, or salary). And it’s not a predictor of health, but the average cost the church is finding itself covering for its staffing structures in 2025.
Volunteers
Even with a lower worship attendance average, the church continues to recruit volunteers at a consistent level, as it was pre-pandemic. When it comes to volunteers, we’ve discovered that 45% of weekend worship attendees (adults and students, but not children) serve regularly in a volunteer role. Typically, this number correlates with the amount spent on staffing; the more paid staff a church has, the lower the volunteer percentage becomes, as more of the work is accomplished by paid workers.
We define “active volunteers” as all individuals who serve at least once a month in any role. This is a count of how many individual people are serving, not how many volunteer roles are in the church. For example, if 10 people collectively hold 20 volunteer roles, the church has 10 volunteers. We will be watching this norm closely, as it is reasonable to expect it may begin decreasing in the near future, particularly as smaller congregations make heavier investments in paid staff.
Find out how to get MORE VOLUNTEERS, GUARANTEED with our Volunteer Accelerator!
Visitor Retention
For the average church, between 10-30% of first-time visitors have the potential to become consistent attendees. This means that, church statistics-wise, for every 10 new people who enter your church doors, most likely you’ll only see one, two, or three again. Conversely, if a church sets a goal to grow by 100 people in a single year, that church will need to see at least 300 first-time guests in that year. Also impacting this conversion rate is the effectiveness of your hospitality and guest follow-up systems.
Involvement in Groups
While data for what’s normal for churches in group involvement is hard to quantify, there are a few targets worth noting. It’s been observed that healthy churches have at least 40-50% of their adult attendance in some form of small groups; great churches have upwards of 80% small group participation. For this measure, we’re defining any groups that serve as some kind of ‘micro community’. That includes groups like a men’s Bible study, a young adult Sunday school class, and discipleship huddles
Facilities
A church’s ministry is also impacted by the physical layout of its campus and the benefits (or constraints) therein. Two specific features of facilities are particularly noteworthy when churches are looking to see growth: parking spaces and seating capacity.
Parking Spaces: Most churches need one parking space for every 1.66 attendees (or 3 spaces for every 5 people). If you count your current number of parking spaces, then multiply that by 1.66, you’ll find the maximum number of people who can attend a single service in your church. Of course, this number may be very different in certain contexts where walking or public transportation options are more readily accessible.
Seating Capacity: Most church services will simply stop growing once the worship center is 80% full on a regular basis. While something may be done to push the attendance higher for a season, it will likely settle back around 80%. While the seating doesn’t necessarily change, a church that has seen a decline can rest confident in its capacity to achieve its attendance goals.
One way to continue to add capacity in both parking and seating is to add additional worship services prior to making any physical changes to the campus. As a church adds services, it’s also important to keep in mind that a 2nd service will typically reach 80% of the amount of the first service, and a third service will typically reach 60% of the first service.
What’s next?
First: Consider + Converse
As you consider this information, look for the places where your church differs from the national average and invite your church leaders into a conversation about those variations. Here are some questions you might want to ask:
- Why do we vary?
- Is there more than one reason?
- Do we want to change?
- If so, do we feel equipped to change?
- What specific steps do we need to take?
- And who will be responsible for those steps?
- Do we need help?
- What kind of help do we need?
Want to take a look at other specific ministry norms?
Revised and edited by Bryant Johnson, Director of Consulting, November 2025.